

At its core, calculating share of voice is pretty straightforward. You take one of your brand's key metrics—like social media mentions or website traffic—and divide it by the total for your entire market. Multiply that by 100, and you've got your percentage. This simple calculation is a fantastic health check for your marketing, showing you exactly how visible your brand is compared to the competition. Getting this right is the first step to truly understanding where you stand.

Why Share of Voice Is Your Competitive Edge
Before we get bogged down in formulas, it’s important to understand why Share of Voice (SOV) is so much more than a marketing buzzword. It's a direct reflection of your brand’s visibility and, more importantly, a powerful predictor of your future market share. Think of it as a vital sign for your brand's health across every channel you care about.
Back in the day, SOV was a simple measure of ad spend. But things have changed. By 2022, the concept had broadened to cover a whole spectrum of marketing channels, from your organic social media footprint to your website traffic. This evolution shows just how critical SOV has become for gauging brand awareness and dominance in today's digital conversations. For a deeper dive, check out HubSpot's take on modern SOV and its role in brand health.
This expanded view makes SOV an invaluable diagnostic tool. It uncovers strategic gaps you might otherwise never see. For instance, you might have a killer social media presence but almost zero visibility in search results. That’s a classic imbalance. It tells you that while you’re great at engaging your existing audience, you’re failing to pull in new customers who are looking for solutions on Google.
Share of voice isn’t just about shouting the loudest in every conversation. It's about strategically placing your brand in the discussions that matter most to your audience and adding real value to the industry narrative.
This is precisely why you need to calculate share of voice with care. It's not just about crunching numbers for a report; it’s about making smarter strategic moves that will secure your brand’s growth and keep you one step ahead of everyone else.
Leading Versus Lagging Indicators
One of the most common points of confusion I see is the difference between Share of Voice and Market Share. They're related, sure, but they play very different roles in your strategy. Put simply, SOV is a leading indicator, while market share is a lagging one.
- SOV (Leading Indicator): This measures your current visibility and how much of the conversation you own. A high SOV today is a strong signal of market share growth tomorrow. It's your crystal ball.
- Market Share (Lagging Indicator): This reflects past sales and historical performance. It tells you where you’ve been, not necessarily where you're headed. It's your rearview mirror.
This distinction is crucial. When you focus on boosting your SOV, you’re actively investing in future growth. In fact, a brand that consistently holds a higher share of voice than its share of the market is almost always on a growth path. This concept is known as having an "excess share of voice" (eSOV), and it's a well-documented predictor of success.
Share of Voice vs Market Share at a Glance
To make this crystal clear, let's break down the key differences. Understanding this table is fundamental to shifting your mindset from reactive to proactive.
| Metric | What It Measures | Indicator Type | Strategic Insight |
|---|---|---|---|
| Share of Voice (SOV) | Brand visibility, conversation dominance | Leading | Predicts future growth; identifies marketing opportunities |
| Market Share | Percentage of total sales in a market | Lagging | Reflects past performance; shows historical success |
Thinking in terms of SOV gives you a forward-looking perspective. It allows you to allocate your resources more effectively, building a resilient brand that can anticipate trends and outmaneuver competitors for the long haul.
Gathering the Right Data for an Accurate SOV

Any share of voice (SOV) calculation is only as good as the data you feed it. Garbage in, garbage out—it's a classic rule that absolutely applies here. If you start with weak or incomplete information, you'll end up with a skewed picture of your market standing, which can lead to some seriously flawed strategic decisions.
Before you even think about formulas, you have to decide what you're actually measuring. Are you zeroing in on a single channel, like social media, or do you need a bird's-eye view across search, paid ads, and PR? The answer dictates what data you need to hunt down.
Let's walk through exactly what you need to collect and where to look.
Defining Your Search and SEO Data
When it comes to organic search, your SOV is all about how visible you are on the search engine results pages (SERPs) for the keywords your customers are actually using. So, your first job is to build a master list of those keywords.
Don't just stick to your brand name. Think like a customer. What problems are they trying to solve? What words would they type into Google to find a solution like yours? A powerful tool like Ahrefs or Semrush is a massive help here, letting you uncover the high-intent keywords your audience is really searching for.
Once you have your keyword list, it's time to identify your real digital competitors. This isn't just about the companies you think you're up against; it's about who actually shows up for your target keywords.
My Two Cents: I’ve seen it time and again—a company's biggest business rival is almost never their biggest SEO competitor. You might find a niche blog or a scrappy affiliate site gobbling up traffic for your most valuable terms. You have to include them in your analysis.
With your keywords and competitors locked in, you need to pull these core data points:
- Organic Keyword Rankings: Where you land for each target keyword.
- Click-Through Rate (CTR): The percentage of people who click your link based on its ranking position.
- Total Search Volume: The estimated number of monthly searches for your keywords.
Collecting Social and PR Mentions
On social media, your mission is to capture the volume of conversation happening around your brand versus your competitors. This is way more than just counting your @mentions.
To get a full picture, you need to track several types of mentions:
- Direct Brand Mentions: The obvious tags, like @YourBrand.
- Indirect Mentions: When someone mentions your brand name without tagging your account.
- Relevant Hashtags: This includes your branded hashtags and broader industry ones.
- Competitor Mentions: You’ll need to track all of the above for your key rivals, too.
Tools like Brand24 or Sprout Social are built for this stuff, automating the heavy lifting of finding mentions across different platforms. For PR, a simple (but effective) trick is setting up Google Alerts for your brand and competitor names to keep an eye on media coverage.
Finding Paid Advertising Metrics
For pay-per-click (PPC) advertising, the data is much more straightforward because it lives right inside your ad platform. The most important metric to calculate share of voice in this arena is Impression Share.
Put simply, Impression Share tells you what percentage of possible impressions your ads actually received. For instance, a 40% impression share means that for every 10 times your ad was eligible to show, it was displayed 4 times.
You can find this data right in your Google Ads or Microsoft Ads account by adding the "Competitive metrics" columns to your reports. This gives you a clean, quantifiable measure of your visibility in paid search and is one of the easiest SOV metrics to track consistently.
The Math Behind Share of Voice: A Simple Breakdown
Calculating your share of voice isn't some dark art guarded by data scientists. Honestly, the core math is surprisingly simple. It’s a basic formula you can use across just about any marketing channel to get a read on your brand's visibility.
The fundamental equation looks like this:
(Your Brand’s Metric / Total Market Metric) x 100 = Your Share of Voice %
The real trick isn't in memorizing this formula. The expertise comes from knowing exactly what to plug in for your "metric" and your "market." What you track for social media is entirely different from what you measure for paid search, and that's where the nuance comes in.
Getting Your Metrics and Market Right
Think of the "metric" as your specific data point, and the "market" as the total of that metric across all your competitors, plus your own brand. The most important rule here is consistency. If you're not making an apples-to-apples comparison, your data is practically useless.
Here’s how this works in a few common scenarios:
- SEO: A great metric is organic traffic share for a specific bucket of high-value keywords. Your total market metric would then be the combined traffic for those keywords across all the competitors you’re tracking.
- Social Media: The go-to metric is usually the volume of brand mentions. So, if your brand was mentioned 100 times and the total conversation (including competitors) had 1,000 mentions, you’ve got a social SOV of 10%.
- PPC: This is often the most straightforward. Your metric is Impression Share, which is a standard report you can pull directly from your Google Ads account.
This process flow chart gives you a quick visual. It shows a simple social media SOV calculation where a brand with 250 mentions in a market of 1,000 total mentions lands a 25% share of voice.
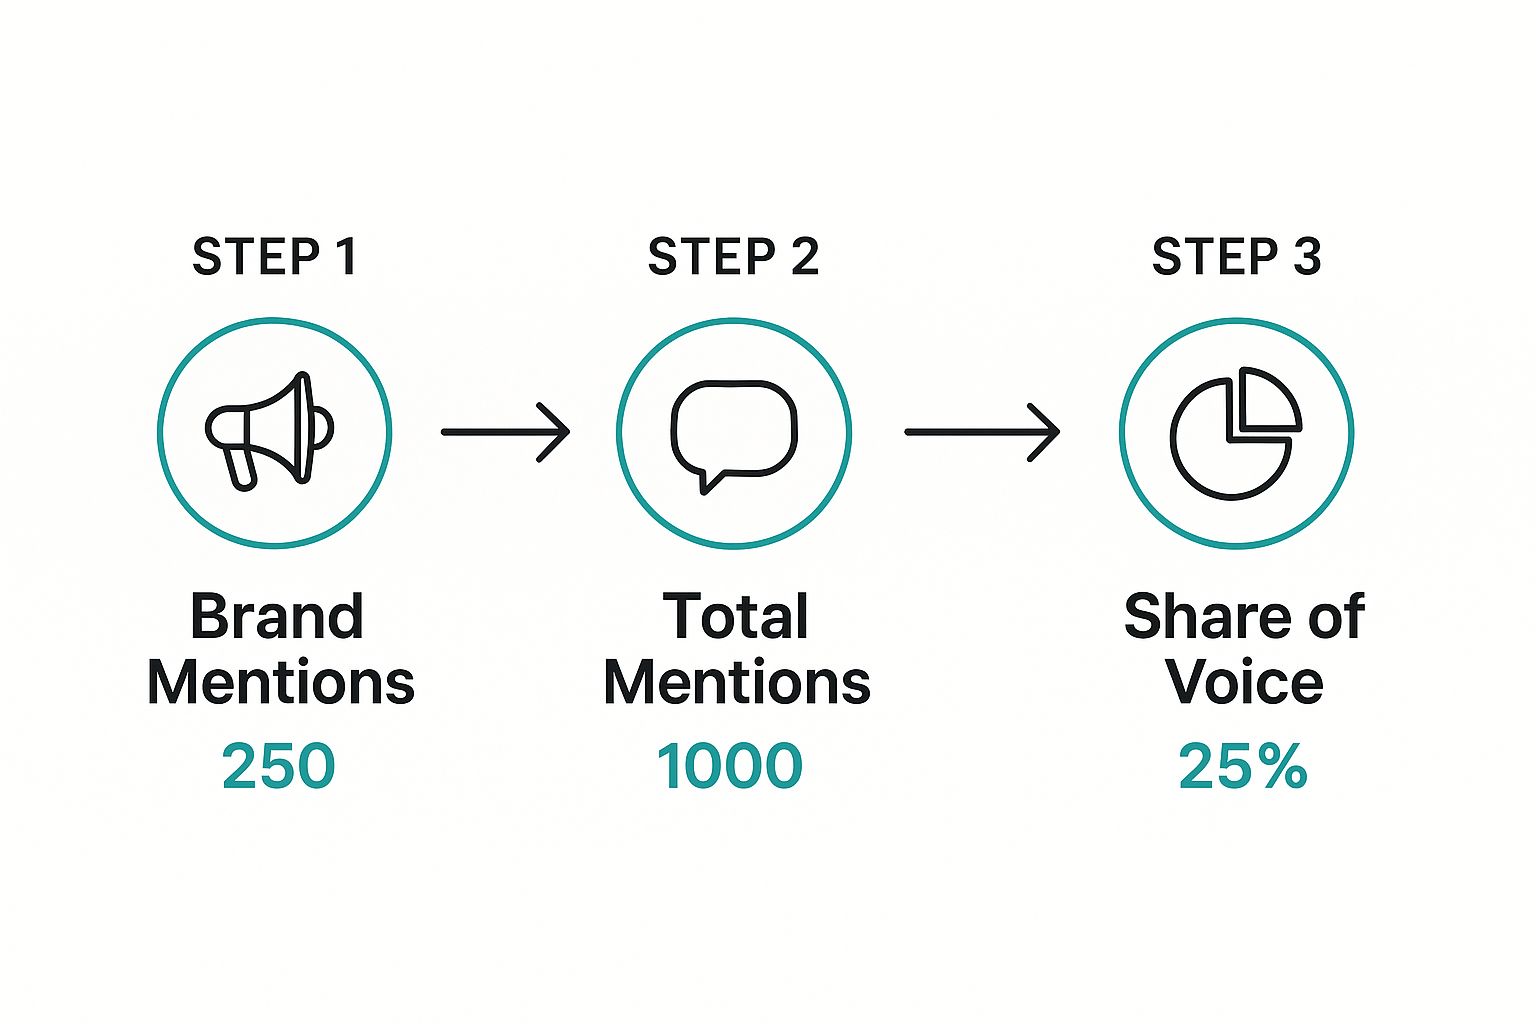
As you can see, it's all about slotting your brand's performance into the bigger picture to get that final percentage.
Looking Beyond the Basic Formula
Modern analytics tools have made it much easier to calculate SOV across different channels, from social listening to SEO and paid ads. While the core idea—your piece of the pie divided by the whole pie—remains the same, what counts as a "mention" can change dramatically. For more on this, check out this guide on how to measure share of voice from Brand24.com.
In SEO, a "mention" might be your visibility for certain keywords. In advertising, it's all about your impression share.
This is why a single, all-encompassing SOV number can be dangerous. A 30% SOV on social media tells a completely different story than a 30% SOV in paid search. The first points to strong brand conversation and community engagement, while the second reflects ad spend and a solid bidding strategy. Grasping this context is what transforms raw data into smart decisions, helping you build a more complete strategy with a platform like LLaMO Pro.
Calculating SOV Across Different Channels
Having one single, blended Share of Voice (SOV) number is a great way to get a quick snapshot of your market presence. But the real magic happens when you break that number down by channel. This is where you uncover the actionable insights—where you're dominating, where you're just holding on, and where you're practically invisible.
Getting this granular view is the only way to calculate share of voice that actually informs a smart, multi-channel marketing plan. The approach for each channel is a bit different, since you’re working with completely different metrics. Let’s walk through how to do it for the channels that likely matter most to your business.
Pinpointing Your Organic Search SOV
For organic search, SOV is much more than just where you rank. It’s about how much real estate you own on the search engine results pages (SERPs) for the keywords you care about. Think of it as answering the question: "For all the people searching for our target terms, what percentage of their clicks are we actually capturing?"
To get a real handle on this, you need to pull together a few key data points:
- Keyword Rankings: Simple enough—where do you show up for your most valuable search terms?
- Estimated Click-Through Rate (CTR): Based on your ranking position, what’s the likely percentage of people who will click your link?
- Total Search Volume: What's the combined monthly search demand for your entire keyword list?
This is where platforms like Ahrefs or Semrush become indispensable. You can plug in your keyword list and your competitors, and they'll crunch the numbers to spit out a "visibility score" or "share of voice" percentage. This figure represents your slice of the total organic traffic pie for those specific keywords.
Gauging Visibility in Paid Search
When we turn to pay-per-click (PPC) advertising, the calculation gets much simpler and more direct. The metric you need to live and breathe here is Impression Share. The best part? It's sitting right there in your Google Ads account.
Impression Share tells you exactly what percentage of the time your ads were shown out of the total number of times they could have been shown. For instance, if you have a 60% impression share, it means your ad appeared in 6 out of every 10 auctions you were eligible for. It's a beautifully clean measure of your ad visibility against everyone else bidding on the same terms.
Measuring Your Social Media Presence
On social media, SOV is all about who owns the conversation. We’re moving beyond vanity metrics like follower counts and getting to the heart of brand relevance. The question here is: how many people are talking about your brand versus your competitors?
The whole calculation hinges on tracking brand mentions.
- Your Brand Mentions: Every time your brand is mentioned directly (@YourBrand) or even just by name ("Your Brand Name").
- Total Market Mentions: This is simply the combined mentions for your brand plus all the competitors on your radar.
Doing this manually is nearly impossible, so social listening tools like Sprout Social or Brand24 are essential. They track mentions, hashtags, and even sentiment across the social web. With that data, a straightforward way to calculate share of voice is: (Your Mentions / Total Market Mentions) x 100.
This classic advertising-based definition of share of voice shows how it's traditionally calculated based on ad spend.

While the formula itself comes from the world of ad budgets, the core principle is the same for any digital channel: it's your slice of the total activity in the market.
Tracking Public Relations and Media Mentions
Finally, let's look at PR. Your SOV here is measured by your presence in news articles, industry blogs, podcasts, and other media outlets. You’re trying to see how often your brand gets featured compared to your rivals.
A high PPC impression share but a low organic SOV is a major red flag. It signals a risky over-reliance on paid ads, leaving you vulnerable if ad budgets are cut. This channel-specific insight is exactly why a granular SOV analysis is so powerful.
You can get a good start with a media monitoring service or even by setting up some thorough Google Alerts for your brand and competitor names. By simply tallying up these mentions over a given month or quarter, you can get a solid directional sense of your media SOV. This data is invaluable for spotting which publications favor your competitors and helps you refine your whole outreach strategy.
Turning Your SOV Insights into Actionable Strategy
So, you’ve done the math and calculated your share of voice. Great. But that number is just the beginning—it’s the diagnostic, not the cure. The real value comes when you take that raw data and turn it into a smart, decisive marketing plan.
Think of it this way: you need to compare your share of voice to your actual market share. This one comparison is incredibly revealing. It tells you where your brand stands right now and where you have room to grow.
There's a well-known rule of thumb in marketing: your share of voice should ideally be higher than your market share. This gap, known as "excess share of voice" (eSOV), is a powerful indicator of future growth. If your SOV is lagging behind your market share, consider it a red flag—you're at risk of losing ground.
This simple check-up immediately helps you categorize your efforts. You’ll see clear opportunities for growth and spot areas where you’re vulnerable. A high SOV in a channel where you have low market share? That's a huge opportunity. A low SOV where you already have a strong customer base? That's a fire you need to put out, fast.
Diagnosing Your Performance on Each Channel
With this framework in mind, you can start building specific strategies based on what your channel-level SOV data is telling you. Different scenarios demand different actions.
Let's walk through a couple of common situations:
- Low Social SOV: If your brand is barely a whisper in social media conversations, it's time to get proactive. This isn't just about posting more often; it's about starting conversations. A targeted campaign with a few micro-influencers in your niche could be just the ticket to introduce your brand to new, highly engaged communities.
- Weak Organic Search SOV: Is your brand buried on page five of Google? You're missing out on customers who are actively looking for solutions you provide. The best move here is a thorough content gap analysis. Find out which valuable keywords your competitors are ranking for, then build a content plan to create genuinely helpful articles and pages that target those exact terms.
Bridging the Gaps with Smart Tactics
Sometimes your analysis will uncover a more complicated picture, like a major imbalance between your paid and organic channels.
Imagine your PPC impression share is a dominant 70%, but your organic search SOV is a measly 5%. This is a classic sign that you're leaning too heavily on paid ads. They get you quick wins, sure, but your brand's long-term foundation is shaky. What happens if your ad budget gets slashed or CPCs go through the roof?
The action plan here is pretty clear: reinvest a portion of that ad spend into a solid, long-term SEO strategy. This builds a more resilient marketing engine, making sure your brand stays visible without being totally dependent on ad dollars.
Or maybe your media SOV is strong—journalists are covering you—but your social SOV is weak. This tells you that while the press is interested, that excitement isn't translating into customer conversations. It’s a cue to invest in community management to turn passive readers into active advocates for your brand.
Traditionally, SOV was all about ad spend. For example, if an electronics company spends $5 million on ads in a market where the total ad spend is $100 million, its share of voice is 5%. This core principle—owning a piece of the total conversation—is exactly what we're applying to every channel, and you can learn more about how it relates to market growth on Wikipedia.
Got Questions About Share of Voice? We've Got Answers.
As you start working with share of voice, a few questions always seem to pop up. It's totally normal. Getting a handle on these key points from the get-go helps you use this metric wisely and avoid common pitfalls when reading the data.
How Often Should I Calculate Share of Voice?
One of the first things people want to know is how frequently they should be running these numbers. For most brands, I've found that a quarterly basis hits the sweet spot. It's often enough to catch important shifts and give you time to adjust your strategy, but you won't be chasing your tail reacting to every minor blip on the radar.
Of course, there are exceptions. If you're in the middle of a massive product launch or operate in a super competitive, fast-paced market, switching to a monthly check-in can give you a real edge. When the stakes are that high, you need to be able to pivot quickly.
What Is a Good Share of Voice Percentage?
This is the million-dollar question, but the truth is, there's no magic number. "Good" is completely relative to your industry, your competitors, and what you’re trying to achieve.
Instead of chasing an arbitrary percentage, a much better goal is to aim for a share of voice that is higher than your current market share.
This is what we call "excess share of voice" (eSOV), and it's one of the most reliable leading indicators of future market share growth. The real goal isn't just to be present; it's to consistently out-talk your direct competition in the places where your customers are listening.
Can I Calculate SOV Without Expensive Tools?
Absolutely. Many small business owners or marketers on a tight budget ask this, and the answer is yes—it just requires a bit more elbow grease. You can definitely get a directional sense of your SOV using free methods.
Here’s a simple, no-cost way to get started:
- Google Alerts: A classic for a reason. Set up alerts for your brand name and your top 2-3 competitors. It’s a straightforward way to monitor media mentions.
- Manual Searches: Once a week or so, open an incognito browser window and search for your most important keywords. See where you land. It’s not perfect, but it gives you a snapshot of your organic visibility.
- Social Media Spot Checks: Head directly to platforms like X (formerly Twitter) or LinkedIn. Run searches for your brand name and your competitors' names to see who is driving the conversation.
This manual approach won't give you the pinpoint accuracy of a paid tool, but it provides valuable insights that are far better than flying blind, especially when you're just starting out.
Ready to see how AI perceives your brand? LLaMO Pro conducts a full visibility audit to uncover gaps in your digital presence, helping you refine your strategy to improve how you’re seen by large language models. Get your free audit today at LLaMO Pro.