

Let’s get straight to it: Share of Voice (SOV) is a no-nonsense measure of your brand's visibility compared to your competitors. A solid share of voice calculation isn't about vanity; it’s about turning a fuzzy marketing concept into a hard number that tells you exactly how much of the conversation you own in your market. It’s what guides real strategy.
Why Share of Voice Is Your Most Important Metric

It’s easy to dismiss SOV as a simple vanity metric, but I’ve seen firsthand that this is a critical mistake. It's one of the most powerful benchmarks you can track for brand health, competitive standing, and audience engagement across every channel that matters.
Think of it as a leading indicator of what’s to come. A rising SOV today often precedes a bump in market share tomorrow. This metric forces you to look beyond your own bubble and get a clear-eyed view of the entire competitive picture. Without it, you’re basically marketing in the dark and making decisions based on gut feelings instead of hard data.
The Core SOV Formula
At its heart, the math is straightforward. The basic way to calculate Share of Voice is to divide your brand's total mentions by the total mentions for all brands in your space (including you), then multiply by 100 to get a percentage.
So, if your brand gets 100 mentions and the total industry conversation has 1,000 mentions, your SOV is 10%. Simple, right? This logic applies everywhere—from social media to SEO, media coverage, and paid ads. While each channel uses different metrics, the fundamental formula doesn't change. You can learn more about how this became a standard for measuring brand visibility on Talkwalker.com.
Key Takeaway: A higher Share of Voice is directly tied to stronger brand awareness and authority. It’s not just about being part of the conversation—it’s about leading it.
Grasping this simple concept is your first step toward building a dominant brand presence.
Key Metrics Across Channels
The specific metric you plug into a share of voice calculation will change depending on where you're looking. The formula stays the same, but what you measure has to adapt to the channel.
To make this easier, I've put together a quick-reference table that breaks down the primary metrics to focus on for each key channel.
Key Share of Voice Metrics by Channel
This table breaks down the primary metrics used to calculate Share of Voice across different digital marketing channels, providing a quick reference for what to track.
| Channel | Primary Metric for SOV Calculation |
|---|---|
| Social Media | Brand Mentions, Branded Hashtag Usage |
| Organic Search (SEO) | Keyword Rankings, Impression Share |
| Paid Media (PPC) | Impression Share, Click Share |
| PR & Media | Number of Media Placements, Publication Reach |
Focusing on these distinct metrics ensures your calculations are relevant and accurate for each part of your marketing mix. This approach is what takes you from a vague sense of your visibility to a precise, actionable understanding of where you really stand against the competition.
Laying the Groundwork for Accurate SOV Tracking

Jumping straight into a share of voice calculation without doing the prep work is like trying to navigate without a map. You'll get numbers, sure, but they won't mean much. The real magic happens before you even touch a calculator, and it all starts with defining the battlefield. This initial groundwork is what turns confusing data into sharp, actionable insights.
The whole process kicks off with a simple but crucial question: who are you really up against? If you only focus on the obvious industry giants, you're missing a huge part of the picture.
Your competitor list needs to be more than just the usual suspects. Think about the emerging disruptors and the small, niche players who are quietly carving out their own space in the conversation. If you ignore them, you're tracking an incomplete market and leaving yourself blind to new threats.
Defining Your Competitor Landscape
I find it helps to bucket competitors into a few categories. This simple framework ensures you don't overlook anyone who matters.
- Direct Competitors: These are the no-brainers. They sell a similar product to the same people you do. If you're selling running shoes, this is your Nike and Adidas.
- Indirect Competitors: These brands solve the same core problem, just with a different solution. For a running shoe brand, a company selling high-end stationary bikes could be an indirect competitor—they both target fitness enthusiasts.
- Aspirational Competitors: These are the titans of the industry, the ones you look up to. You might not be competing with them head-to-head today, but tracking their SOV gives you a valuable benchmark to strive for.
With your list of competitors in hand, the next step is to get granular with the keywords and terms you'll track. This is where most people trip up.
A classic mistake is just tracking your brand name. This gives you a tiny, skewed snapshot of your real-world visibility. A solid share of voice calculation has to account for all the different ways people talk about you, your products, and your industry.
Building Your Keyword and Term Data Set
Think of this as building the dictionary for your entire analysis. The goal is to cast a wide net and capture every relevant mention, not just the low-hanging fruit. Your data set is the bedrock of an accurate share of voice calculation.
So, what should you be tracking? Get organized and be thorough.
Essential Terms to Track:
- Brand Names: Don't just track your official name. Include common abbreviations or variations, too (e.g., "International Business Machines" and "IBM").
- Product & Service Names: Every major product or service needs to be on this list (e.g., "iPhone 15 Pro Max").
- Branded Hashtags: Add any official hashtags from your marketing campaigns or general branding efforts.
- Campaign Slogans: Got a memorable tagline? Track it.
- Key Personnel: For many businesses, the CEO or other key executives are a huge part of the brand's voice. Their mentions count.
- Common Misspellings: This one is easy to forget, but crucial. People make typos. Add common misspellings of your brand and products to catch those conversations.
For instance, a company like LLaMO Pro wouldn't just track "LLaMO Pro." We'd also be listening for things like "LLaMO audit," "brand visibility AI," and even potential typos to get the full story.
Honestly, this prep phase is non-negotiable. If you don't have a clearly defined competitor list and a comprehensive set of terms, any share of voice calculation you run will be built on a shaky foundation. Take the time to get this right. It ensures the insights you generate reflect reality and can actually be used to guide your strategy.
Getting Your Hands Dirty: Calculating SOV Across Your Marketing Channels
Alright, you've done the prep work. You know who your competitors are and which keywords matter. Now it's time to roll up your sleeves and move from theory to the nitty-gritty of calculation.
The truth is, a modern share of voice calculation isn't a single, clean formula. The metrics that define your presence on social media are worlds apart from what matters in organic search or paid ads. You have to adapt your approach for each channel to get a clear picture.
This is where the real work begins—and where you start to uncover actionable insights. We’ll walk through exactly how to calculate SOV for the channels that have the biggest impact on your visibility.
This simple diagram breaks down the core logic, which thankfully stays the same no matter which channel you're measuring.
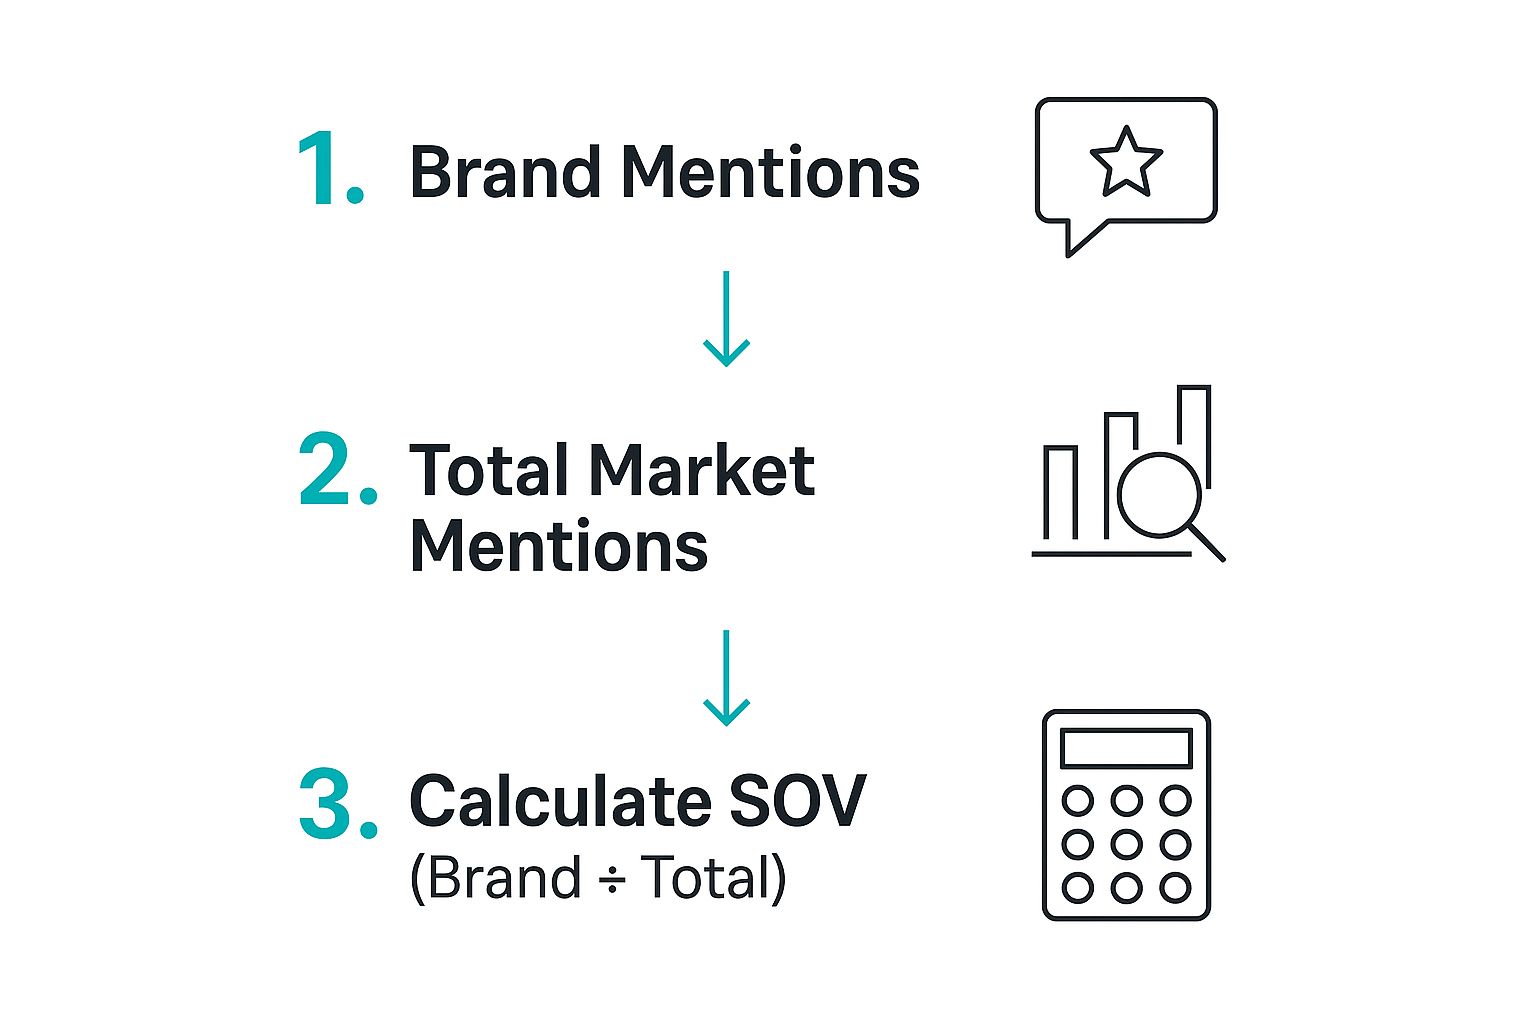
At its heart, it's always the same idea: measure your brand's slice of the pie against the whole pie. You gather your data, you gather the total market data, and you do the math.
Decoding Social Media Share of Voice
Let's start with social media, which is often the most conversational and fast-moving space. Here, your share of voice calculation is a direct measure of how much of the online chatter your brand actually owns compared to your competitors.
We're not just counting passive impressions; we're looking for tangible engagement and acknowledgments of your brand.
- Brand Mentions: Every time someone uses your handle (like @YourBrand) or types out your brand name.
- Branded Hashtag Usage: How often people use your official hashtags, like #YourBrandCampaign.
- Untagged Mentions: This is a big one. You need to track mentions of your brand name even when you aren't tagged. This is where a good social listening tool becomes invaluable.
Let’s put this into practice. Imagine you're a craft coffee company running a campaign for a new cold brew called #ChillBrewSummer. Your main rivals are "Roast Masters" and "Daily Grind Coffee."
To figure out your social SOV for July, you would:
- Fire up your social listening tool and pull the total mentions for your brand—that includes your handle, name, and the #ChillBrewSummer hashtag. Let's say you find 2,500 mentions.
- Now, run the same search for "Roast Masters" and "Daily Grind Coffee" for the same month. They pulled in 4,000 and 3,500 mentions, respectively.
- Add it all up to get the total market conversation: 2,500 (you) + 4,000 (Roast Masters) + 3,500 (Daily Grind) = 10,000 total mentions.
- Finally, apply the formula: (2,500 ÷ 10,000) * 100 = 25% SOV.
That 25% gives you a powerful piece of intel: for every four conversations about the top craft coffee brands in your space, one of them is about you.
Nailing the Organic Search SOV Calculation
When we shift to SEO, the conversation changes from social chatter to pure visibility on the search engine results page (SERP). An SEO share of voice calculation tells you what percentage of all potential organic traffic you're actually capturing for your target keywords.
Considering that organic search still drives over 53% of all website traffic, this is a metric you absolutely can't afford to ignore. The main metric here is often called "search visibility" or "impression share," and it’s a weighted figure based on your rankings and keyword search volume.
A key insight is that ranking #1 for a low-volume keyword is less valuable than ranking #5 for a keyword with 100,000 monthly searches. A proper SEO SOV calculation accounts for this.
To measure this accurately, you'll need an SEO platform like Ahrefs or Semrush. The process involves tracking your defined keyword list—the one you built earlier—for both your domain and your competitors'.
Let's say you run an online plant shop. You've identified 50 key phrases, everything from "buy monstera deliciosa online" to "low-light houseplants."
Using your SEO tool, you see that over the last month, your site captured an estimated 15,000 organic clicks from that keyword list. The tool also shows that the total estimated clicks available for that entire set of keywords, across all websites, is 100,000.
Your SEO SOV calculation is straightforward: (15,000 your clicks ÷ 100,000 total market clicks) * 100 = 15% SEO SOV. You are currently winning 15% of the available organic traffic for the keywords that matter most.
Assessing Your Paid Media SOV
For pay-per-click (PPC) ads, the share of voice calculation is much more direct because the ad platforms practically hand it to you. In Google Ads, this metric is called Impression Share. It represents the percentage of impressions your ads received compared to the total number they were eligible to get.
Eligibility is based on your budget, targeting, and ad quality. An Impression Share of 40% means your ads are sitting on the sidelines for 60% of the searches they could have appeared on.
Thankfully, Google Ads does the heavy lifting.
- How to find your Impression Share: In your account, navigate to Campaigns, Ad Groups, or Keywords. Click the "Columns" icon, go to "Competitive metrics," and add the "Impression share" columns to your report.
This data isn't just for reporting; it's incredibly actionable. If your Impression Share is low, Google will often tell you why. It typically boils down to two culprits:
| Reason for Lost Impression Share | What It Means in Plain English |
|---|---|
| Lost IS (budget) | You ran out of cash. Your daily budget was spent before the day was over, so your ads stopped showing. |
| Lost IS (rank) | Your Ad Rank was too low to compete. This is a mix of your bid and Quality Score. Competitors either outbid you or had more relevant ads. |
By digging into this data, you can make smarter decisions. You can either allocate more budget or focus on improving your Ad Rank to grab a bigger piece of the paid search pie. This turns SOV from a vanity metric into a potent diagnostic tool for your campaigns.
Finding the Right Tools for SOV Measurement

Let's be honest. Trying to calculate your share of voice manually is a recipe for frustration. For any brand that's actually trying to grow, it's pretty much impossible. The sheer amount of data across social media, search results, and news sites makes tracking it all by hand a futile exercise.
This is where the right tools come in. They aren't just a convenience; they’re essential. They turn a nightmare of a task into a strategic advantage. The market is packed with options, though, and picking the right one can feel like a job in itself. The secret is knowing that different tools are built for different channels. Your job is to assemble a toolkit that gives you the complete picture where it matters most.
Choosing Your Channel-Specific Tools
You’ll quickly find that most platforms shine in one or two areas. It's incredibly rare to find a single tool that does everything perfectly. You're usually better off picking the best-in-class tool for each channel you care about, rather than an all-in-one that’s just okay at everything.
Think of it like building a toolbox. You wouldn't use a hammer for a screw, right? The same logic applies here. The tool you lean on for SEO share of voice isn't going to be the right choice for tracking social media buzz.
Here’s how the main categories break down:
- Comprehensive SEO Suites: For anything related to organic search, these are your workhorses. Tools like Ahrefs or Semrush are fundamental for tracking keyword rankings, estimating traffic share, and digging into competitor backlinks. They form the bedrock of any serious SEO-focused share of voice calculation.
- Social Listening Platforms: When you need a finger on the pulse of the social conversation, you need a dedicated listening tool. Platforms like Brandwatch or Talkwalker are designed to scoop up brand mentions, monitor hashtags, and analyze audience sentiment in real time. Crucially, they catch all the untagged mentions that a manual search will always miss.
- Dedicated Media Monitoring Services: For the PR pros, media monitoring is non-negotiable. Services like Cision or Meltwater scan an enormous database of online news, print media, and even broadcast transcripts. This is how you measure your media relations impact and see how you stack up against the competition in the press.
My Personal Tip: Start with the channel that drives the most revenue. If you're a B2B company built on organic leads, a top-tier SEO suite should be your first investment. If you're a direct-to-consumer brand that lives and dies by social trends, a powerful social listening platform is your priority.
A Decision-Making Framework for Selecting a Tool
Just knowing the categories isn't enough. You need a practical way to vet different platforms against your team’s specific needs and budget. A flashy tool with a hundred features you’ll never touch is just a waste of money. The goal is to find what delivers actionable data.
As you compare your options, run them through this checklist. Any solid SOV tool should check most, if not all, of these boxes.
| Feature to Evaluate | Why It Matters for SOV Calculation |
|---|---|
| Sentiment Analysis | Knowing how many people are talking about you is only half the picture. You need to know how they feel. A spike in SOV is a disaster if it's fueled by a PR crisis. |
| Real-Time Alerts | The conversation online moves at lightning speed. Real-time alerts for brand mentions or keyword surges let you jump on opportunities or threats, instead of reading about them in a report a week later. |
| Competitive Benchmarking | The whole point of SOV is comparison. The tool absolutely must make it easy to track your competitors with the same metrics in a clear, side-by-side view. |
| Historical Data Access | You need to see the bigger picture. A tool that only shows data from the last 30 days prevents you from measuring long-term campaign success or identifying seasonal trends. |
| Customizable Dashboards | Your CEO and your social media manager need to see different things. The ability to create custom reports ensures everyone gets the data they need without the extra noise. |
Ultimately, the best tool is the one your team will actually use. Before you sign any long-term contract, take full advantage of free trials. Set up tracking for your brand and a couple of key competitors. Get a feel for the interface and see if the data it kicks out leads to genuine "aha!" moments. That hands-on experience is the only way to know if a tool is a good fit for your workflow and will truly help you master your share of voice calculation.
From Numbers to Strategy: Making Your SOV Work for You
So you've calculated your share of voice. You have a neat, tidy percentage. But what now? That number is just the starting line. The real magic happens when you translate that percentage into a concrete strategy that actually moves the needle for your brand. Raw data is interesting, sure, but actionable data is what builds empires.
Don't mistake a high SOV for a simple vanity metric. It's one of the most powerful leading indicators of business health I've ever come across. There's a well-established link between dominating the conversation in your niche and seeing your sales figures climb. A rising SOV is often the first sign that market share growth is right around the corner. This isn't just theory; I've seen it play out in brutally competitive markets time and time again.
Take the athletic footwear market, for example. Nike’s dominance in online conversations is staggering. From May to June, their SOV hit an incredible 94.4%, leaving competitors like Reebok in the dust with just 5.6%. This wasn't a one-off event; it mirrored the data from the previous month. This kind of commanding presence online directly correlates with their market leadership in sales. You can dig into more examples of how top brands protect their voice over at Brand24.com.
This proves that a consistently high SOV isn't just background noise—it’s a direct reflection of brand strength and a reliable predictor of future success.
Look Beyond the Percentage
A single SOV number on its own can be incredibly deceptive. A 15% share of voice means very little until you understand the story behind it. Is that conversation positive, or is it a firestorm of negative reviews? Is your voice booming on one channel while being completely silent on another?
To get real value, you have to push past the basic share of voice calculation and start asking tougher questions.
- What's the sentiment? A high SOV fueled by a PR nightmare or an avalanche of customer complaints isn't a win—it's a massive red flag. You absolutely must segment your mentions into positive, negative, and neutral categories.
- Where are we loud (and where are we quiet)? Are you crushing it on Instagram but totally absent from critical industry forums? Mapping your channel-specific SOV shows you where to double down on your strengths and where you have glaring, costly gaps.
- What topics do we "own"? When people talk about you, are they saying "amazing product quality" or "terrible customer service"? Analyzing the topics driving your brand's conversation tells you what the market really thinks you stand for.
My Two Cents: The goal is never just to get a bigger share of voice. The real objective is to strategically grow your positive share of voice in the channels and conversations that are most critical to hitting your business goals.
Reacting to Your Competitors' Moves
Your SOV data is also one of the best competitive intelligence tools you have. It's a live feed of what your rivals are doing and how the market is reacting, letting you make precise moves instead of just guessing.
Think about how you can use it in a couple of common situations.
Scenario 1: A small competitor’s SOV suddenly spikes.
Don't ignore this. It’s an early warning shot.
- Your Move: Immediately dive into their mentions. Did they launch a viral campaign? Land a huge press feature? Understanding why their voice grew tells you whether you need to launch a counter-campaign or simply adjust your messaging.
Scenario 2: A major rival’s sentiment takes a nosedive.
Their crisis is your opportunity.
- Your Move: Pinpoint the source of their negative press. Are customers furious about a product flaw or a recent price hike? You can quickly deploy ads or content that highlights your brand's superiority in that exact area, poaching their unhappy customers.
By consistently watching the competitive field through the lens of SOV, you shift from being reactive to being proactive. You stop just reporting on what happened and start shaping what happens next. This is how a simple share of voice calculation transforms from a passive measurement into your most potent strategic weapon.
Common Questions About Share of Voice (Answered)
Once you start digging into share of voice calculations, you'll inevitably run into a few questions. It’s a fantastic metric, but let's be honest, the details can get a little fuzzy. I've put this section together to tackle the most common things people ask, so you can stop second-guessing and start using the data with confidence.
We'll cover everything from how often you should be crunching the numbers to the crucial difference between SOV and market share. My goal here is to give you the clarity you need to make smarter, faster decisions.
How Often Should I Calculate Share of Voice?
There’s no single right answer here—it really comes down to the rhythm of your industry and whatever campaigns you have in the pipeline. But we can definitely set some solid benchmarks.
If you’re in a fast-paced space like consumer tech, or you're in the middle of a big product launch, tracking weekly or even daily can be a game-changer. It gives you immediate feedback on what's landing, like seeing the ripple effect from a press release or a new ad flight in near real-time.
For most businesses, though, a monthly calculation is the sweet spot. It's frequent enough to catch important trends and see how your campaigns are moving the needle, but not so frequent that you get bogged down by meaningless daily blips. From there, you can use a quarterly review to zoom out and focus on bigger-picture strategy.
The most important thing is consistency. Whether you decide on weekly, monthly, or quarterly, lock it in. Sticking to a schedule is what builds the historical data you need to see long-term patterns and the true impact of your work over time.
What Is the Difference Between SOV and Market Share?
This is probably the single most important distinction to grasp. Getting this wrong can send your entire strategy sideways. They sound related, but they measure completely different things and tell you different stories about your business.
Market Share is a lagging indicator. Think of it as looking in the rearview mirror. It tells you what percentage of total sales you already captured. For example, "We sold 10% of all widgets last quarter." It’s purely historical.
Share of Voice, on the other hand, is a leading indicator. It’s a snapshot of your brand's slice of the conversation happening right now. A rising SOV is often a direct signal of future growth, pointing to growing awareness and purchase intent. It’s a powerful tool for predicting where you're headed, not just where you've been.
Can My Share of Voice Be Negative?
Mathematically, no. The share of voice calculation is a percentage of a total, so the number itself will always be positive. You can't have a negative slice of a pie.
However, the sentiment behind that voice can absolutely be a dumpster fire. This is where a lot of people make a rookie mistake—they see a big SOV number and pop the champagne, without looking at why people are talking.
A huge SOV spike driven by a PR crisis, a flood of product complaints, or a viral customer service nightmare is a major red flag, not a win. It means you’re dominating the conversation for all the wrong reasons. This is exactly why modern SOV tools have sentiment analysis baked in. You need to see your share of positive, neutral, and negative voice. The real goal isn't just a bigger SOV; it's a bigger positive SOV.
Is It Possible to Calculate SOV for a Niche Industry?
Yes, absolutely. In my experience, it's often more insightful in a niche market. The basic principles of the share of voice calculation are identical, but the playing field is smaller and more defined, which works to your advantage.
The process is the same:
- Pinpoint your direct competitors in that specific niche.
- Define the highly specific keywords, industry jargon, and topics your audience actually uses.
- Measure your visibility against the total (but much smaller) pool of conversation.
Because the overall conversation volume is lower and more focused, your marketing efforts create much bigger, more obvious ripples. A single, well-placed article or a targeted social campaign can cause a significant, measurable spike in your SOV. It's an incredibly effective way to prove you’re the leading expert in a specialized field.
Ready to see how AI perceives your brand's visibility? LLaMO Pro conducts a comprehensive audit to reveal how large language models rank your brand, uncovering gaps in your content strategy and discoverability. Get your free audit from LLaMO Pro and start improving your AI-driven presence today.