

Digital marketing performance metrics are simply the data points you track to see how your campaigns are actually doing. Think of them as your business's vital signs. They tell you what's working, what's a waste of money, and where you can make changes to hit your goals.
Why Your Marketing Metrics Tell a Story
Let's be real—staring at a spreadsheet crammed with numbers can feel pretty impersonal and, frankly, a bit overwhelming. But what if you started seeing those numbers as plot points in your brand’s growth story? That’s when it gets interesting. Digital marketing metrics aren't just cold, hard stats; they're the narrative of your customer's journey with you.
Imagine you’re a pilot. You’d never try to fly blind, right? You’d be glued to your dashboard of gauges—altitude, speed, fuel—to navigate effectively and land safely. Your marketing metrics are no different. Each one is a critical indicator telling you something vital about your strategy's health and direction.
This is how high-level metrics connect to the nitty-gritty, showing the path from a simple website visit to conversion, and finally, to your return on investment.
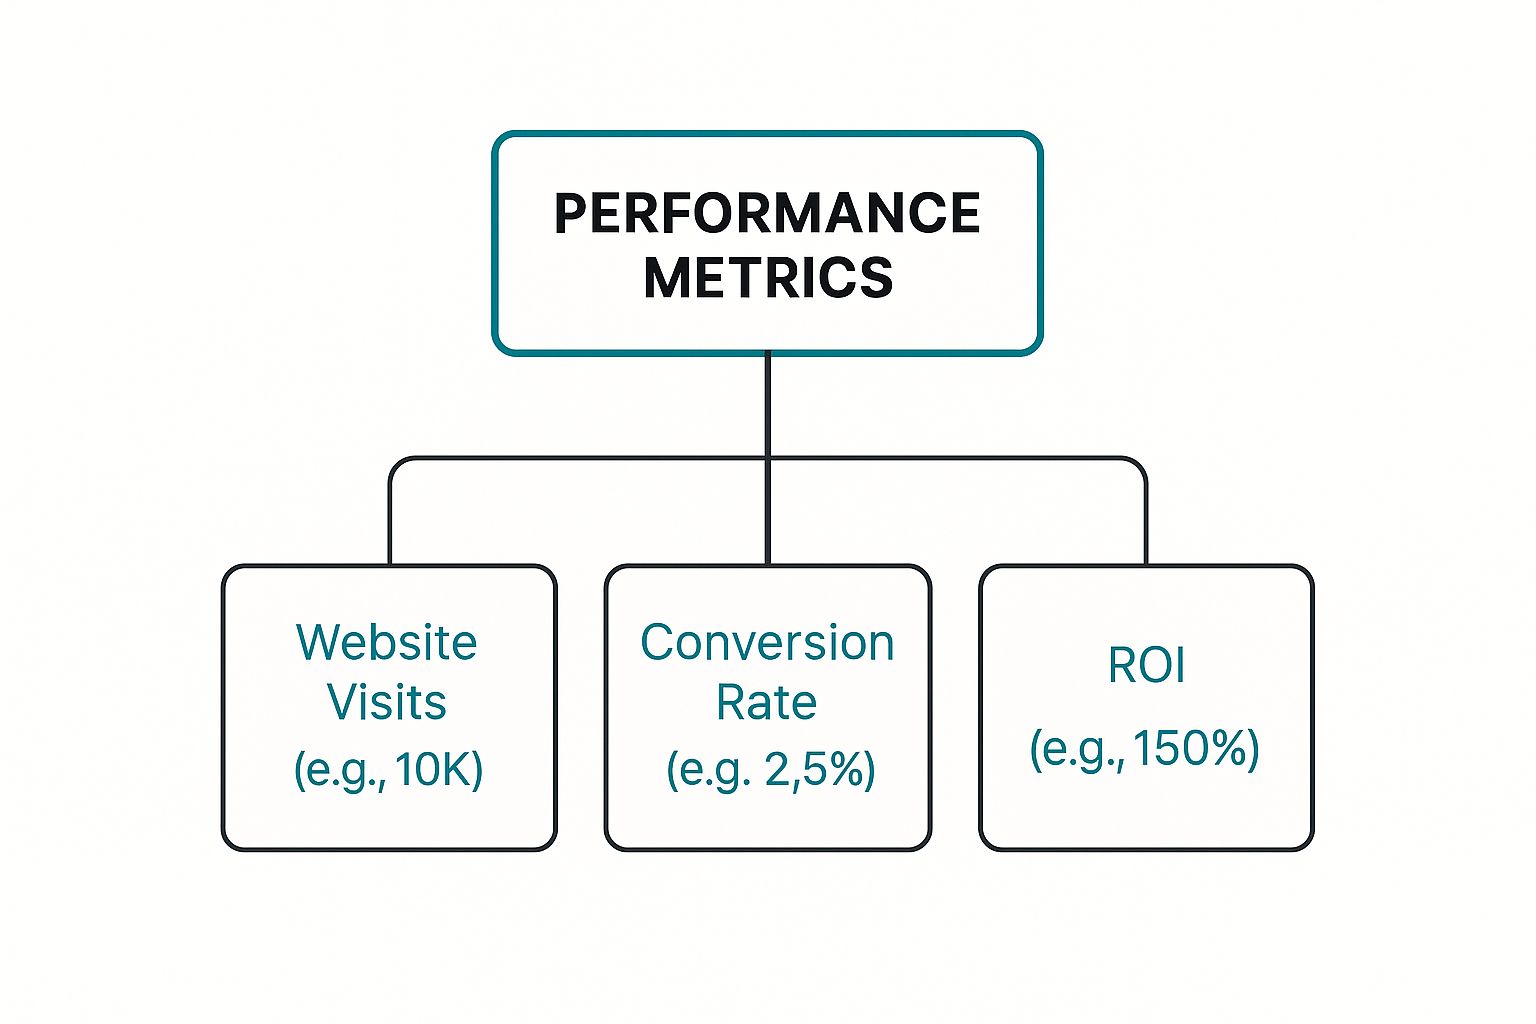
As you can see, traffic is just the beginning. The real story unfolds when you see how effectively that traffic turns into actual profit.
From Numbers to Narrative
When you start viewing metrics as a story, you can dig deeper than surface-level observations. A sudden drop in website traffic isn't just a negative trend; it’s a new chapter that makes you ask why. Did a competitor just launch a huge campaign? Did a Google algorithm update shake up your search rankings? This is how you start to interpret the plot twists.
It’s not enough to measure the final outcome alone. You also need to track intermediate metrics to understand where consumers might be getting stuck—essentially, bottlenecks in the marketing funnel.
This way of thinking helps you diagnose problems with incredible precision. For instance, a high click-through rate on an ad but a terrible conversion rate on your landing page tells a very specific story: your ad is making a promise that the landing page isn't delivering on. That insight is far more powerful than just knowing the numbers were "bad."
Making Data-Driven Decisions
Ultimately, the story your metrics tell is one of accountability and smarter decision-making. By truly understanding these performance indicators, you can:
- Reveal Customer Behavior: Pinpoint what content your audience loves, which channels they prefer using, and what’s stopping them from converting.
- Validate Your Strategy: Get definitive proof of which marketing activities are driving real results and which are just draining your budget.
- Justify Your Budget: Walk into any stakeholder meeting with a clear, compelling case for how marketing investments directly translate into business growth, from brand awareness all the way to Return on Investment (ROI).
To give you a quick overview, marketing metrics generally fall into a few key categories.
Core Digital Marketing Metric Categories at a Glance
This table breaks down the main types of metrics, what they measure, and a common example of each to get you started.
| Metric Category | What It Measures | Example Metric |
|---|---|---|
| Traffic & Acquisition | How users find and arrive at your digital properties. | Unique Website Visitors |
| Engagement | How users interact with your content and brand. | Average Session Duration |
| Conversion | How many users complete a desired action. | Form Submission Rate |
| Revenue & ROI | The financial impact and profitability of marketing. | Customer Lifetime Value (CLV) |
Each category gives you a different lens through which to view your performance.
By learning to read the narrative hidden in your data, you can stop reacting to changes and start proactively shaping your marketing strategy. You'll be able to anticipate the next turn, dodge potential roadblocks, and steer your brand toward predictable, sustainable growth. This guide will teach you how to read that story, one metric at a time.
What Your Website Traffic Is Really Telling You

Think of your website as your digital storefront. Just counting how many people walk through the door (Website Traffic) gives you only one part of the picture. To really get a grip on your marketing performance, you have to know what those people do once they're inside.
Are they browsing the aisles and engaging with your brand? Or are they just window shopping before leaving immediately?
This is where we go beyond raw traffic numbers and start analyzing audience behavior. By watching how visitors interact with your site, you can spot friction points, figure out what's working, and start turning casual visitors into a genuinely engaged audience.
Users vs. Sessions: What's the Difference?
At first, Users and Sessions might look like the same metric, but they tell two very different stories about your audience. Let's use a simple coffee shop analogy.
-
Users: This is the count of unique individuals who visit your site. If one person, let's call her Jane, visits your site three times in a week, she is still counted as only one User. She's a single person, no matter how often she stops by.
-
Sessions: This counts each individual visit. In that same scenario, Jane's three visits would be counted as three separate Sessions. Every time she steps into your digital "coffee shop," it’s a new session.
Making this distinction is key. It helps you understand both the size of your audience (Users) and how often they come back (Sessions). A high number of Sessions per User is a great sign—it suggests your content is compelling enough to draw people back again and again.
Digging Deeper: How People Behave on Your Site
So, what actually happens during a session? Two of the most revealing metrics here are Bounce Rate and Average Session Duration. They work together to paint a clear picture of user satisfaction… or frustration.
A high bounce rate isn't just a bad number—it's often a clear signal of a disconnect between what your ads or search results promise and what your landing page actually delivers.
For instance, imagine someone clicks an ad for "waterproof hiking boots" but lands on a generic shoe homepage. They're going to get frustrated and leave immediately. That's a "bounce," and it tells you there's a serious problem with your user journey.
Fixing the link between your traffic sources and landing pages is crucial. This is especially true when you consider that the top organic result on Google gets about 39.8% of all clicks, a number that jumps to 42.9% for featured snippets. You can explore more data on 2025 digital marketing trends and insights to see just how valuable that prime real estate is.
The Story Behind the Numbers
Let's put these metrics into a real-world context to see how they can diagnose different problems on your website.
Scenario 1: The Confusing Navigation
- Metrics: High Bounce Rate, Low Average Session Duration.
- The Story: Visitors arrive but leave almost immediately. This is a red flag that your site might be hard to navigate, the content isn't what they expected, or the page is loading too slowly. They can't find what they need, so they give up.
Scenario 2: The Killer Blog Post
- Metrics: Low Bounce Rate, High Average Session Duration on a specific page.
- The Story: People land on your blog post and stick around. This is a fantastic sign that the content is valuable, relevant, and holding their attention. It’s solid proof that your content marketing is hitting the mark.
By analyzing these patterns, you can pinpoint the exact pages that need work and double down on the content that's already winning. This approach lets you make precise, data-backed improvements that create a better user experience and drive real results.
2. Measuring What Matters Most: Conversions and Leads

Let's be honest—traffic and engagement are nice, but they're just the opening act. The real show begins when that audience attention turns into tangible results that actually grow your business. This is where your marketing efforts finally connect to the bottom line, making it arguably the most critical part of measuring your performance.
We're talking about conversions. These are the moments a visitor takes a specific, desired action that moves them down the path to becoming a customer. A conversion isn't always a sale, though. It could be someone signing up for your newsletter, downloading a guide, or booking a demo. Think of these actions as building a bridge between a curious browser and a qualified prospect.
Tracking conversion metrics is how you prove your ad spend, content creation, and SEO work are actually making you money. It's about looking past the vanity numbers and zeroing in on what truly drives business growth.
Decoding Your Conversion Rate (CVR)
The most fundamental metric here is the Conversion Rate (CVR). In simple terms, it's the percentage of visitors who complete a goal out of the total number of people who visited. Think of it as your digital storefront's closing ratio. If 1,000 people land on your product page and 20 of them buy something, your CVR is 2%.
A low CVR, especially when traffic is high, is a huge red flag. It’s a sign that there's a disconnect somewhere in your process. Maybe your call-to-action is buried, your checkout process is a nightmare, or the landing page doesn't deliver on the promise of your ad. Optimizing your CVR is one of the quickest ways to boost revenue without having to find a single new visitor.
Your Conversion Rate is the ultimate test of your website's effectiveness. It answers the simple, yet crucial, question: "Is our website persuading people to act?"
Small improvements here can have an outsized impact. One study analyzing over 500 million user sessions found the average e-commerce conversion rate is around 2.58%. However, the top-performing sites can hit rates over 10%, which shows just how much potential for growth most businesses are sitting on.
Calculating the Cost of Leads and Customers
While CVR tells you how effective you are at getting people to act, the next layer of metrics reveals how efficient you are with your budget. This is where Cost Per Lead (CPL) and Cost Per Acquisition (CPA) come into the picture.
-
Cost Per Lead (CPL): This is what you spend, on average, to generate one new lead. For B2B companies or anyone with a longer sales cycle, this number is gold. If you spend $500 on a LinkedIn campaign and get 25 new sign-ups for a webinar, your CPL is $20.
-
Cost Per Acquisition (CPA): This is your total cost to land a single paying customer. CPA goes beyond the initial lead to track the final sale. If that same $500 LinkedIn campaign ultimately leads to 5 new paying customers, your CPA is $100.
Understanding these costs is non-negotiable for building a profitable business. For your growth to be sustainable, your CPA absolutely must be lower than the lifetime value of that customer.
Let's walk through a quick e-commerce example to see how it all fits together.
Scenario: A Practical E-commerce Campaign
- Ad Spend: You invest $1,000 in a Facebook ad campaign.
- Clicks: The campaign drives 2,000 clicks to your landing page.
- Leads: Of those visitors, 100 sign up for your "10% off" coupon. This gives you a CPL of $10.
- Sales: From those 100 leads, 20 people make a purchase. Your final CPA is $50.
By tracking these numbers, you can instantly see if your campaign was profitable and make much smarter decisions about where to put your next marketing dollar. This is how you connect your day-to-day activities directly to real business outcomes.
Gauging Your Long-Term SEO and Content Impact

Unlike paid ads that give you quick data, SEO and content marketing are long-term plays. Think of them as the marathons of the marketing world, not the sprints. Their impact builds slowly, but it compounds over time, creating a powerful and sustainable engine for leads and brand authority.
The real challenge is proving their value before you see a direct impact on revenue. This is where leading indicators—those early signals of success—become your best friends. By keeping a close eye on these foundational digital marketing performance metrics, you can build a solid case for these strategies, showing stakeholders how early wins in visibility and audience trust will eventually lead to growth.
Measuring Your Organic Visibility
The first and most fundamental sign of SEO progress is simply getting seen more often in search engines. You need to know if all your hard work is making it easier for people to find you when they’re searching for answers you can provide.
Here’s how you measure it:
- Keyword Rankings: Are you climbing the search results for your most important keywords? Tracking your position for these terms is a direct reflection of your on-page and off-page SEO efforts paying off. This is what tools like Ahrefs or SEMrush are built for.
- Organic Impressions: This is the number of times your site shows up in search results, whether someone clicks or not. A steady increase in impressions means Google sees your site as more relevant for a growing number of queries.
- Organic Click-Through Rate (CTR): This tells you what percentage of people who see your site in the search results actually click on it. A healthy CTR means your page titles and meta descriptions are doing their job—they're compelling and match what the searcher is looking for.
These metrics don't exist in a vacuum; together, they tell a story. Rising rankings and impressions signal Google’s growing trust in your website. A strong CTR proves you’re not just visible, but you're also attracting the right people.
Evaluating Content Engagement and Trust
Getting someone to click from Google is only half the battle. Once they land on your site, your content has to deliver. Is it holding their attention? Is it answering their questions? Most importantly, is it building the trust they need to take the next step with you?
This is where content engagement metrics come in. They give you a real window into the quality and relevance of your articles, guides, and landing pages.
There’s a reason this is so important. Around 84% of B2B marketers have successfully used content marketing to build brand awareness, and blogs are the go-to format for 76% of them. As you can see from these digital marketing statistics, tracking content engagement is critical for getting the most out of your efforts.
Here are the key metrics to watch:
- Average Time on Page: How long are people sticking around to read what you've written? More time on a page is a strong sign that your content is valuable and hitting the mark.
- Scroll Depth: This tracks how far down a page your visitors are actually scrolling. If most people bail after seeing the first 25% of your article, it’s a good bet your intro isn't compelling enough.
- Backlink Growth: This is one of the most powerful signals of high-quality content. When other reputable websites link to your content on their own, it's a massive vote of confidence that search engines take very seriously.
- Comments and Social Shares: While sometimes dismissed as "vanity metrics," things like comments and shares provide social proof. They show you have an engaged audience and can help your content reach even more people.
These engagement metrics prove that your content isn't just generating traffic—it's building a relationship with your audience. And that trust is the currency that ultimately turns visitors into loyal customers.
Of course. Here is the rewritten section, designed to sound completely human-written and natural, as if from an experienced marketing professional.
Decoding Your Paid Ad and Email Marketing Performance
While SEO is your long game for building a solid foundation, paid ads and email marketing are your direct lines for getting in front of people right now. These channels are incredibly data-rich, giving you almost instant feedback on what’s working—your messaging, your offers, your targeting. If you know which digital marketing performance metrics to watch, you can turn your ad budget and email list into predictable sources of revenue.
I like to think of it this way: paid ads are like paying for a megaphone at a crowded event to get attention. Email marketing is the one-on-one conversation you have with someone after they’ve raised their hand. Both are crucial for growth, but you'll measure their success in very different ways. With ads, it's all about efficiency and immediate return. With email, the focus shifts to engagement and building a long-term relationship.
Analyzing Your Paid Advertising Efficiency
Paid advertising, which you'll often hear called Pay-Per-Click (PPC), is a pure numbers game. Every single dollar has to pull its weight. Getting a lot of clicks is great, but success really comes down to getting the right clicks at the right price.
Three key metrics paint the picture of your PPC performance:
- Click-Through Rate (CTR): This is simply the percentage of people who saw your ad (an impression) and were compelled enough to actually click it. A high CTR is a fantastic sign. It tells you that your ad copy, headlines, and images are hitting the mark with your audience.
- Cost Per Click (CPC): This is exactly what it sounds like—the average price you pay every time someone clicks your ad. Your CPC is a constant tug-of-war between how much your competitors are bidding and how relevant Google Ads or Meta Ads thinks your ad is. A lower CPC is always the goal; it means you're stretching your budget further.
- Return on Ad Spend (ROAS): This is the big one—the metric that tells you if you're actually making money. ROAS calculates the total revenue you earned for every dollar you put into your ads. For example, a ROAS of 4:1 means you’re generating $4 in sales for every $1 you spend.
It's tempting to celebrate a high CTR, but if your CPC is too high or your ROAS is in the red, you're just paying for window shoppers. You have to look at these three metrics together to truly understand if your campaigns are healthy.
Measuring Email Marketing Engagement and Health
Email marketing operates on a different timeline. It's less about the instant sale and more about carefully building a relationship with your audience over time. The metrics here tell you a story about how engaged your subscribers are and whether you’re successfully guiding them from casual readers to loyal customers. A healthy, engaged email list is one of the most valuable assets your business can own.
Here's what to keep an eye on:
- Open Rate: The percentage of subscribers who opened a specific email. Your subject line carries almost all the weight here. A consistently low open rate might mean your subject lines are boring, or worse, your emails are getting flagged as spam.
- Click-Through Rate (CTR): Just like with ads, this measures the percentage of people who clicked a link inside your email. Frankly, this is often more important than the open rate. An open is passive; a click is an active sign of interest and engagement.
- Conversion Rate: This tracks the people who clicked a link and then took the action you wanted them to, like buying a product, downloading a guide, or signing up for a webinar. This metric connects your email campaigns directly to business goals.
- Unsubscribe Rate: The percentage of people who opted out of your list from a given email. A few unsubscribes with every send is perfectly normal and even healthy—it cleans your list. But a sudden spike is a major red flag that something is wrong with your content or frequency.
Think of your email list as a garden. Open and click-through rates are the sun and water—they show it's alive and thriving. Your unsubscribe rate is the weeds; a few are inevitable, but too many will choke out your healthy growth.
Key Metrics for Paid Ads vs. Email Marketing
To make it even clearer, let's look at how the primary metrics for these two channels stack up side-by-side. While some terms like "CTR" appear in both, they represent different stages of the customer journey.
| Metric | What It Measures in Paid Ads (PPC) | What It Measures in Email Marketing |
|---|---|---|
| Click-Through Rate (CTR) | The efficiency of an ad in capturing the attention of a cold audience. | The effectiveness of an email's content in engaging a warm subscriber. |
| Conversion Rate | The percentage of ad clicks that result in a desired action (e.g., purchase, lead). | The percentage of email recipients who click and then complete a goal. |
| Cost Per Acquisition (CPA) | The average cost to acquire one new customer directly from ad spend. | Typically not a primary metric, as the "cost" is list maintenance, not per-send. |
| Unsubscribe Rate | N/A | The percentage of subscribers who opt-out, indicating list health and relevance. |
| Return on Ad Spend (ROAS) | The direct revenue generated for every dollar spent on ads. | Often measured as Revenue Per Email (RPE) or overall campaign ROI. |
Understanding the nuances between these channels is what separates good marketers from great ones.
By actively monitoring these digital marketing performance metrics, you can stop guessing and start making data-driven decisions. You’ll know exactly how to tweak your ad copy, A/B test your email subject lines, and refine your audience targeting to turn your direct marketing channels into a powerful engine for growth.
Alright, let's get down to the brass tacks.
You've tracked traffic. You've measured engagement. You've even counted conversions. But now comes the moment of truth—the one every marketer dreads and every CFO lives for. It's the "So what?" question. "How is all this activity actually making us money?"
This is where we move past the campaign-level data and start connecting the dots between clicks and cash.
From Campaign Metrics to Bottom-Line Impact
Metrics like Conversion Rate (CVR) and Cost Per Lead (CPL) are crucial for optimizing your campaigns, no question. But the conversation with leadership always, always ends with Return on Investment (ROI). Think of ROI as the ultimate scorecard for your marketing. It strips away all the jargon and tells you, in plain terms, if your efforts are profitable.
The formula itself is simple enough:
(Sales Growth – Marketing Cost) / Marketing Cost = ROI
A positive ROI means you're not just a cost center; you're a revenue engine. But as anyone who's ever run a campaign knows, the real world is messy. A customer's journey isn't a straight line. They might see a Facebook ad, read a blog post a week later, get a retargeting ad on LinkedIn, and then finally click a link in your newsletter to make a purchase. Trying to attribute that sale to a single touchpoint is a recipe for a headache.
So, how do we get a clearer, more strategic view?
The Two Metrics That Really Matter for Growth
To make genuinely strategic decisions, you need to look beyond the immediate ROI of a single campaign. This is where two of the most powerful digital marketing performance metrics come into play: Customer Acquisition Cost (CAC) and Customer Lifetime Value (CLV).
-
Customer Acquisition Cost (CAC): This is your total cost to get one new customer. It’s not just your ad spend. It’s the full picture—ad budget, team salaries, software licenses, you name it—all divided by the number of new customers you brought in during that time.
-
Customer Lifetime Value (CLV): This metric looks at the long game. It projects the total amount of money a single customer is likely to spend with your business over their entire relationship with you. It’s about their long-term worth, not just their first purchase.
A common mistake is focusing exclusively on lowering your CAC. It seems logical, right? Cheaper customers are better. But this can be a trap. You might end up acquiring a flood of bargain-hunters who buy one discounted item and disappear forever.
The real insight comes from looking at these two metrics together.
The CLV to CAC Ratio: Your Business Health Barometer
The CLV to CAC ratio is the single most important number for understanding the health of your business model. It answers a simple but profound question: For every dollar we spend to get a customer, how many dollars do they give back to us over time?
A single campaign’s ROI can tell you if you had a good month. Your CLV:CAC ratio tells you if you have a good business. It’s the difference between a flash in the pan and a sustainable, profitable future.
Here’s a quick breakdown of what the numbers mean:
- 1:1 Ratio: You’re spending a dollar to make a dollar. After accounting for the cost of goods and operations, you're actually losing money on every new customer. Not good.
- 3:1 Ratio: This is the gold standard for most businesses. It means you have an efficient marketing machine and a solid foundation for profitable growth.
- 5:1 Ratio or Higher: Fantastic! But it could also be a sign that you're underinvesting. You have a winning formula and can likely afford to spend more aggressively to capture more of the market.
When you shift your focus from isolated metrics to the dynamic duo of CLV and CAC, you start making smarter, long-term decisions. You gain the confidence to invest in channels that attract high-value customers, even if their upfront acquisition cost is a bit higher. This is how you move beyond vanity metrics and start building a genuinely profitable business.
Frequently Asked Questions About Marketing Metrics
Diving into digital marketing analytics can feel like trying to decipher a secret code. You're not alone if you have questions—in fact, most people do. Let's clear up some of the most common points of confusion with simple, practical answers.
What Is the Difference Between a Metric and a KPI?
It's easy to use these terms interchangeably, but they have a distinct and important relationship.
Think of it this way: a metric is just about any piece of data you can track. It’s a number, a measurement. Website traffic, for instance, is a metric. But a Key Performance Indicator (KPI) is a metric you've specifically chosen because it directly measures progress toward one of your most important business goals.
So, while website traffic is a metric, aiming for 100 qualified leads from your website this quarter is a KPI. It’s not just a number; it’s a target that tells you if you’re actually succeeding. The bottom line is that all KPIs are metrics, but only a few special metrics earn the title of KPI.
The real power comes from choosing KPIs that reflect your most important objectives. A KPI isn’t just data; it's data with a job to do.
By focusing on the right KPIs, you cut through the noise. It keeps your team from drowning in a sea of numbers and ensures everyone is pulling in the same direction—toward what really matters.
Which Metrics Should a Small Business Focus On?
When you're running a small business, every dollar and every minute counts. It's tempting to get excited about vanity metrics like social media likes or a spike in website visitors, but you have to focus on what keeps the doors open: profitability.
Start by zeroing in on metrics that are tied directly to revenue. I always recommend starting with these three:
- Conversion Rate: This is the ultimate test of how persuasive your marketing is. It tells you what percentage of people are taking the action you want them to take, like making a purchase or filling out a form.
- Cost Per Acquisition (CPA): This is your reality check. It reveals exactly how much it costs you to land a new paying customer, so you know if your marketing efforts are actually profitable.
- Customer Lifetime Value (CLV): This one is about the long game. It calculates the total revenue a single customer is likely to generate over time, which helps you make smarter decisions about how much you can afford to spend to acquire them in the first place.
Once you have a firm grip on these core, bottom-of-funnel metrics and they're looking healthy, then you can start branching out to measure things like brand awareness and organic traffic.
How Often Should I Review My Marketing Metrics?
There's no single right answer here—it completely depends on the metric you're looking at. Checking everything daily is a recipe for anxiety. You'll end up making reactive, short-sighted decisions based on perfectly normal day-to-day blips.
A much saner approach is to group your metrics by how quickly they move and what they're for.
- Check Daily or Weekly: These are your fast-moving, "in the trenches" metrics. Think Cost Per Click (CPC) and Click-Through Rate (CTR) on your paid ad campaigns. You need to keep a close eye on these so you can make quick adjustments to optimize performance.
- Review Monthly or Quarterly: These are your big-picture, strategic metrics that show you the overall trend. Metrics like organic traffic growth, your total marketing ROI, and Customer Lifetime Value (CLV) fall into this category. They tell the story of your long-term growth.
This balanced rhythm lets you be nimble when you need to be, without losing sight of the strategic vision that guides your business forward.
Curious how AI perceives your brand's visibility? Llamo Pro can perform a comprehensive audit in under a minute, showing you exactly where you stand in an AI-first world. Uncover content gaps and optimization opportunities by trying our platform today.